
Scene 2 – Find the village
Since the first part of our “Missing villages” project is already in the finish line, we have to explain the second part, which called “Find the village”.
In the first phase, we tried to name the village, now we have to create the village boundaries, if possible. As we said in the previous article, the delimitation of human habitats is not easy, the structure of the settlement is often region dependent. In the Ruvuma region (southern Tanzania) the settlements are well separated on the map. In contrast, in agricultural areas of the Shinyanga region, delimitation sometimes seems an impossible task.
Sources
According to the data created by Digital Globe and funded by the Gates Foundation, approximately 17 million buildings are in Tanzania. By the time that this study was made, the OSM community has mapped circa 11 million building so far, so using buildings data from OpenStreetMap is not enough, we had to use a different source to identify the settlement pattern. To map populations, we used the previously mentioned data from the Gates Foundation and Facebook’s High-Resolution Population Density data for validation.
Workflow
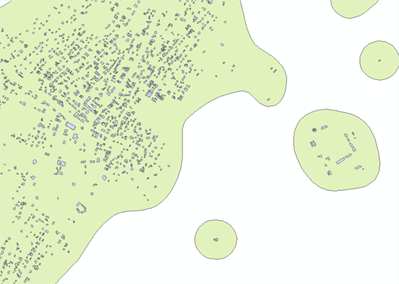
A building aggregation tool was prepared in ArcGIS to aggregate the building footprints (Polygon layer) to produce settlement layers.
- At first, buffer building footprints by 50m was created then merged
- Secondly, the merged multipolygons were divided into single polygons.
- Each settlement patterns area was measured, also the covered buildings were counted for each “building cluster”. These two data can help us to calculate:
- Building density (number of buildings / total area)
- Number of buildings, which data can help to predict the number of the population
- The building density and building number can help in the classification of settlements
- Urban or rural area
- Settlement type: hamlet, village, or town
- During the post-process, sharp angles in polygon were outlined and made smoother to improve aesthetic or cartographic quality. Finally, the unwanted “holes” from polygons were eliminated.
Using this data, we can identify the settlement pattern which can help us creating settlement boundaries for bigger villages, – especially with high building density – and adding to OSM.
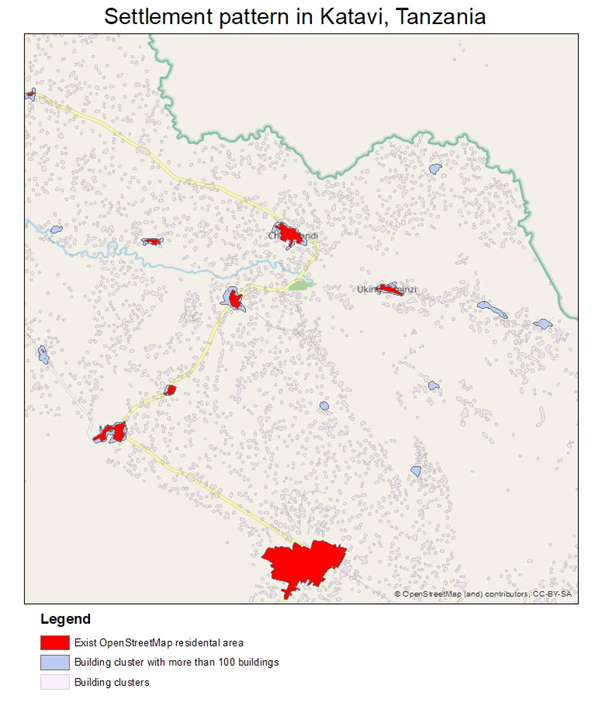
In the final steps, first we have to remove those from the resulting settlement boundaries that are already in the OSM database. Secondly – using the validated settlement POIs, we select those settlement boundaries features that contain the village’s point features.
In the end, the selected village boundaries will be uploaded to OSM and will be waiting for phase 3.