MAPPING SMALL SCALE MINING IN KATAVI REGION

Due to its geological framework, Katavi region is endowed with abundant mineral deposits of different kinds including gold, green tourmaline, gemstone, and copper Most of mining activities are conducted by small scale miners. Gold in the Region of Katavi are found in the following areas  Ibindi, Ugalla, Singililwa, Msagiya Kampuni and Mpanda town.

Miners and processors are a highly dynamic group of people. Particularly in gold mining, there are a lot of rushes in the Region of Katavi that may see thousands of workers come and go in a matter  of months. 1 in 3 workers arrived from a different region, and  many others travel within these vast regions in pursuit of employment opportunities. Often, sites have no adequate infrastructure to deal with the influx of workers. Over half of workers operate on a site that has a makeshift camp where workers live and sleep. 

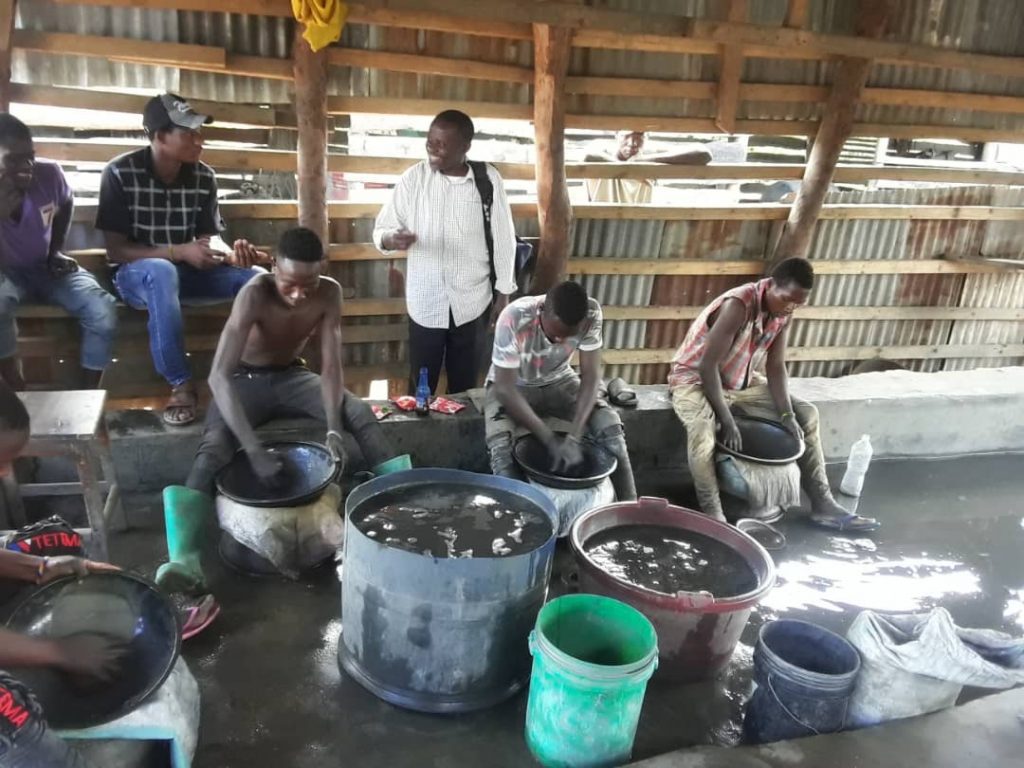
When we visited most of the mining sites in the Region we found that women benefit considerably less from this mineral wealth than men. They remain stuck in lower level positions; they are mainly engaged in processing activities such as crushing and panning. Mining remains a patriarchal sector where men are protective of their positions. As sites are also ill-adapted to women, with, for instance, only few sites having separate sanitary facilities. Paradoxically, most sites cannot function without women, who provide the bulk of support services such as serving food, selling drinks, maintenance and transporting supplies. Another problem prevalent in the mining sites in the Region of Katavi is the problem of child labour. Although illegal, their involvement in mining is widespread. In about half of sites with child labour, children seen working during school hours.

Health and safety are a pressing concern in most mining sites.  There is no access to sanitary facilities in many sites, and where there are available, they are in poor condition or insufficient in number. Combined with the lack of clean drinking water, dust and noise pollution, mines are a breeding ground for numerous infections and disease.

Mining activities also severely impact the environment in Katavi through water pollution, deforestation and land degradation.

Considering these challenges, it is clear that considerable work remains to be done in enforcing the law on these sites. 

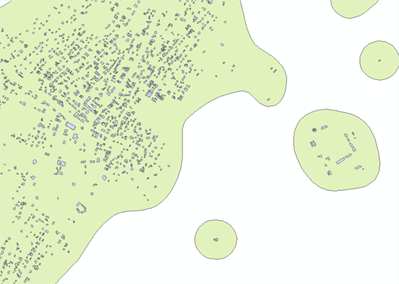
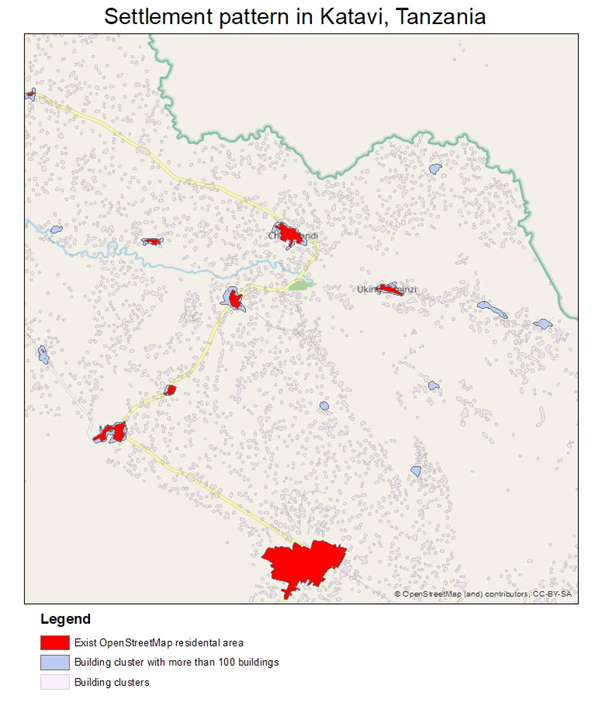
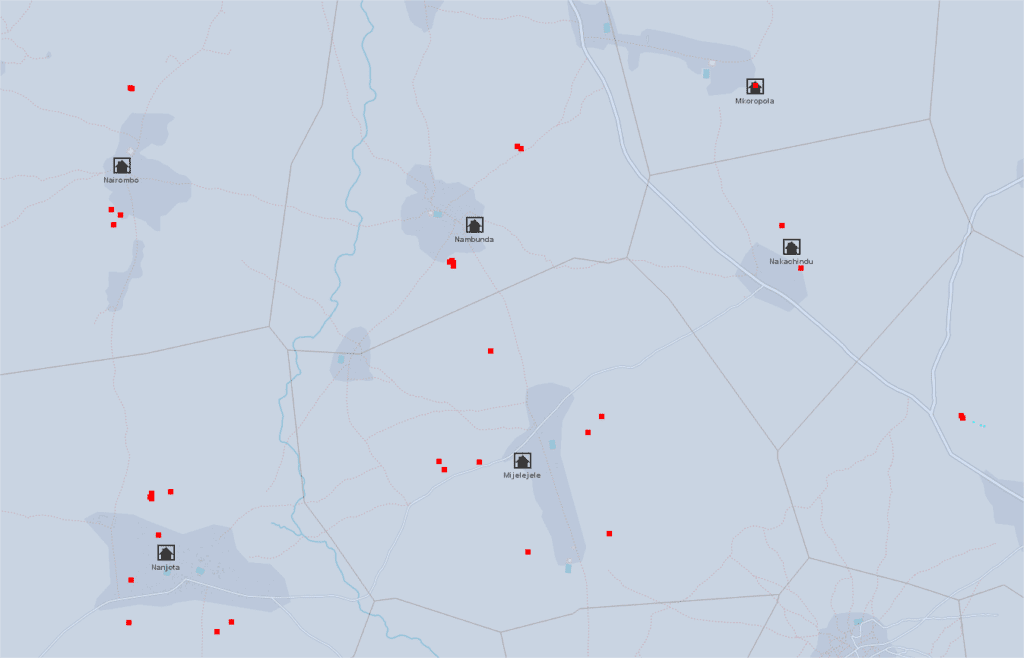
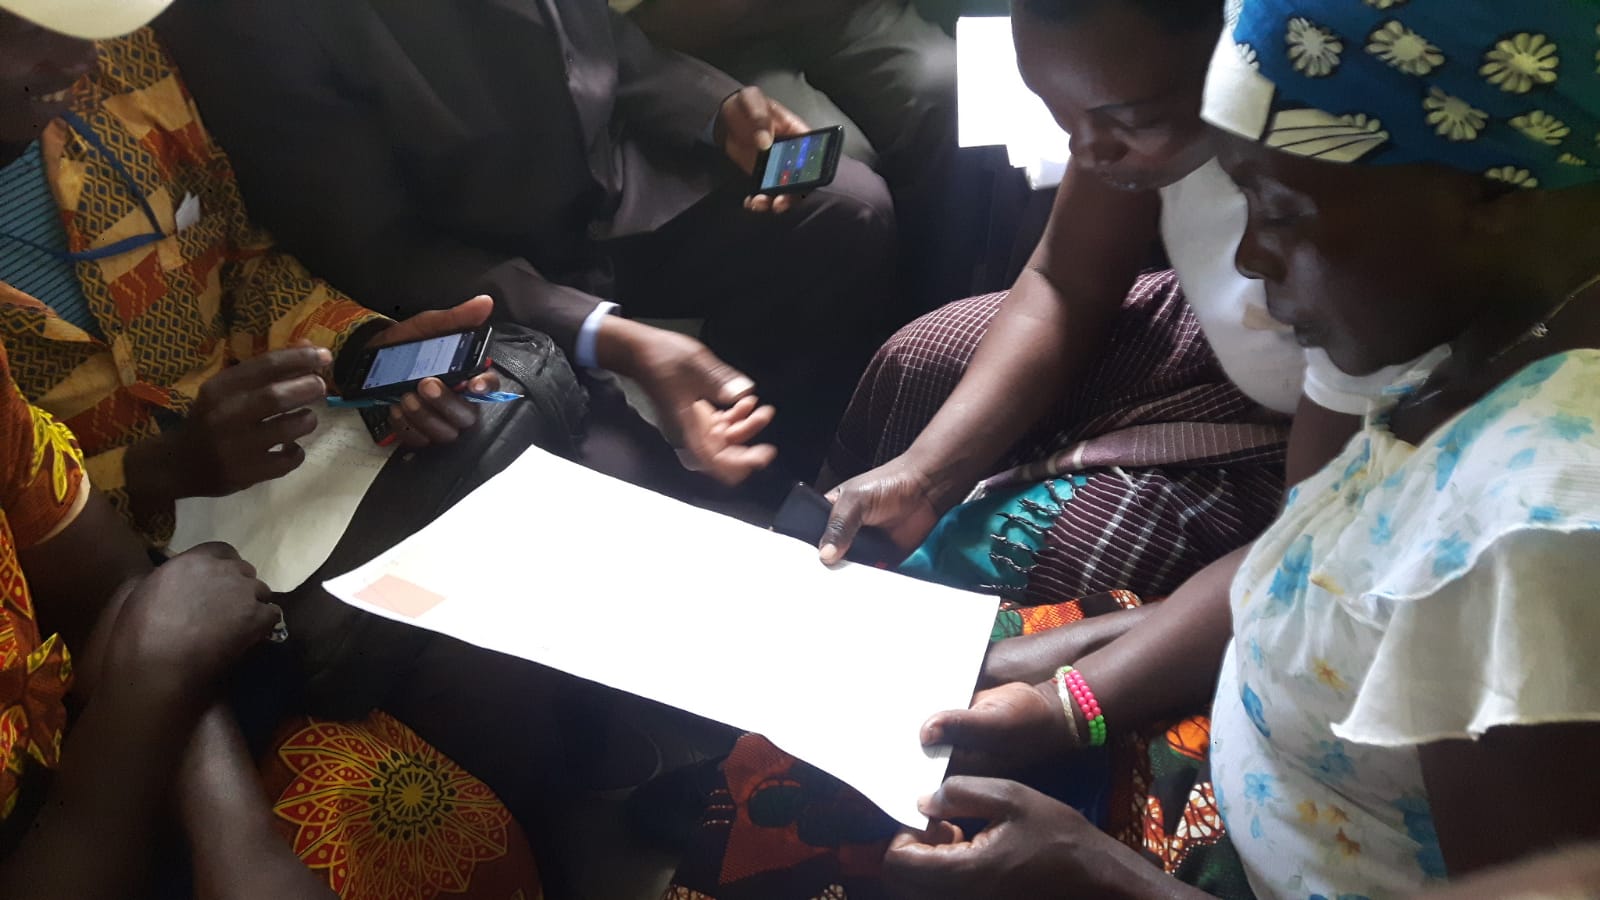
Good Harvest Organisation, in conjunction with the local Red Cross, are mapping the mining the mining sites by training its members and equipping them with mobile phones and open-source mobile data collection applications to capture coordinates, take  pictures and complete dedicated questionnaires, to bridge information gaps around mining in the region of Katavi. This will be done in two main phases.

The first phase will consist of a broad mobile survey on the socio-economic and human rights impact of mining in the region. we will survey all communities around mines on their perceptions regarding the impact of these operations. The findings of this data collection will be published and given to the key stakeholders.  This data will enable hands-on follow-up by the Government of Tanzania and local NGOs.  

Missing villages In Tanzania II

Scene 2 – Find the village

Since the first part of our “Missing villages” project is already in the finish line, we have to explain the second part, which called “Find the village”.

In the first phase, we tried to name the village, now we have to create the village boundaries, if possible. As we said in the previous article, the delimitation of human habitats is not easy, the structure of the settlement is often region dependent. In the Ruvuma region (southern Tanzania) the settlements are well separated on the map. In contrast, in agricultural areas of the Shinyanga region, delimitation sometimes seems an impossible task.

Sources

According to the data created by Digital Globe and funded by the Gates Foundation, approximately 17 million buildings are in Tanzania. By the time that this study was made, the OSM community has mapped circa 11 million building so far, so using buildings data from OpenStreetMap is not enough, we had to use a different source to identify the settlement pattern. To map populations, we used the previously mentioned data from the Gates Foundation and Facebook’s High-Resolution Population Density data for validation.

Workflow

A building aggregation tool was prepared in ArcGIS to aggregate the building footprints (Polygon layer) to produce settlement layers.

  1. At first, buffer building footprints by 50m was created then merged
  2. Secondly, the merged multipolygons were divided into single polygons.
  3. Each settlement patterns area was measured, also the covered buildings were counted for each “building cluster”. These two data can help us to calculate:
    1. Building density (number of buildings / total area)
    1. Number of buildings, which data can help to predict the number of the population
    1. The building density and building number can help in the classification of settlements
      1. Urban or rural area
      1. Settlement type: hamlet, village, or town
  4. During the post-process, sharp angles in polygon were outlined and made smoother to improve aesthetic or cartographic quality. Finally, the unwanted “holes” from polygons were eliminated.

Using this data, we can identify the settlement pattern which can help us creating settlement boundaries for bigger villages, – especially with high building density – and adding to OSM.

In the final steps, first we have to remove those from the resulting settlement boundaries that are already in the OSM database. Secondly – using the validated settlement POIs, we select those settlement boundaries features that contain the village’s point features.

In the end, the selected village boundaries will be uploaded to OSM and will be waiting for phase 3.

Missing villages In Tanzania

Knowing the vast, rural area of Tanzania is crucial to provide timely and effective help for girls during Female Genital Mutilation (FGM) ‘cutting seasons’. In recent years, we have managed to map millions of buildings which can help us determine the distribution of the population. Although low population density areas in Tanzania are not sufficiently mapped yet, the initial steps have already been taken.

Goals of mapping

Crowd2Map Tanzania is a “crowdsourced mapping project aiming to put rural Tanzania on the map”. A primary goal is to help fight against FGM. Girls are rescued and taken to safe houses by local volunteers and police. However, for this they need maps. But maps can do more than just show these rescue teams the way to remote villages. The existence of spatial information can help with development and to increase commercial efficiency and economic growth opportunities for businesses and entrepreneurs, giving them the opportunity to make better-informed decisions. Growing wealth improves the quality of life, gives a chance for more opportunities and a better quality of education.

Find the village

So, we now know where to find traces of human settlements, but how do we delineate each settlement and, more importantly, how do we know what the name of the settlement is?

The delimitation of human habitats is not easy, the structure of the settlement is often region dependent. What does it mean? In the Ruvuma region (southern Tanzania) the settlements are well separated on the map. In contrast, in agricultural areas of the Shinyanga region, delimitation sometimes seems an impossible task.

And what about the names of the settlements? Local volunteers can help us identify all the names of circa 10,000 – 12,000 settlements in Tanzania, OR we can try to find some open source data which contains this information. Recruiting hundreds of volunteers from all over the country is beyond our power, so we need to focus on the second SOLUTION in most places. Fortunately, we have some open source data from The United Republic of Tanzania – Government Basic Statistics Portal, like health facilities or schools, or waterpoints located all over Tanzania.  

Our project objective is to add the missing village names in Tanzania, using open source government data about water sources in Tanzania. 

Water Points Location in Rural Water Supply – 2015-2016

Method for the estimation of village position

The shared database contains about 87,000 water sources, which can be lakes, rivers, machine drilled boreholes or springs. The database also contains the physical condition (quality, quantity) of the water sources as well as their spatial location, indicating, for example, the village name where the water source is, or the nearest village to it. This data helps us determine the name of the village in OSM.

Workflow

For data validation the best possible application is JOSM, which can prepare our data to upload to OSM after data validation. During validation, the next datasets and imagery were used: 

  1. Thyessen polygons were calculated from the water points layer, to get the influence zone of each water point. Then, the polygons were merged by attribute, where the village name is the same. The resulting polygons can help to determine the area where the village has to be.
  2. In the same time, Mean center was calculated for the points inside a polygon → potential position of the village. (Since in a few cases the name of a village occurs more than once in the country, a “village+district” combined data was used to help us to find the real mean center.) This is our village data POI which need to be implemented to OSM.
  3. OpenStreetMap imagery was used to identify the trace of human activity if the area was well mapped. We were also able to get an answer as to whether the name of the settlement has already been given to OSM. 
  4. Maxar satellite imagery was used for those areas that weren’t mapped yet. 
  5. Other useful datasets for validation
    • Waterpoints: can be really useful, if the position of the village’s POI is unusually far from any populated area. In this case, it is worth looking at how each water point is located in the area. Another example, when the village consists of two sub-villages, then the “SUBVILLAGE” attribute of the water database can help determine where the center of the village can be.
    • Health facilities data: The government data contains more than 7,000 health facilities like hospitals or clinics. The names of these facilities are usually, but not exclusively, the same as the name of the municipality where it is located. 
    • Education data: The government data contains almost 7,000 schools. The village names are available in this data. 

In summary

The Voronoi polygon assigns the area where the village is located (or has to be). The village POI assigns the potential location of the settlement, BUT its accuracy depends on the number of water abstraction points and their location in/around the given settlement.

In a well-mapped area - where, moreover, the settlements can be easily separated from each other - we did not have a difficult time with validation (mean centers before validation).
In a well-mapped area – where, moreover, the settlements can be easily separated from each other – we did not have a difficult time with validation (mean centers before validation).
The mean center of the Waterpoints sometimes clearly shows the center of the settlement if these water points are evenly distributed within and around the settlement.

Provisional results

By the end of September, more than 143 districts were validated (88% of all districts), and 5505 villages POIs were added which is 52% of the total village POIs in Tanzania.

User nameTotal edits
Bgabor1802
SHABANI MAGAWILA2255
Kasunga884
Stuart Ward49
Number of edits by users – which was added with “TNZ_missing_villages” hashtag

Crowd2map volunteers in the lead

The OSM database currently contains 10483 Tanzanian village points, a significant part was added by the volunteers of the Crowd2map team. The following pie chat shows how this 10483 POIs is divided between the TOP5 volunteers and the rest of mapper community:

Updated results – 31/10/2020

By the end of October, more than 157 districts were validated (97% of all districts), and 6759 villages POIs were added.

Celebrate the 15th OSM anniversary with a mapathon party!

Crowd2Map with a OpenStreetMap is inviting you to join us from every where in the world for a birthday mapathon! On August 10th, 11am GMT, we will celebrate 15 years of OSM, with local mapping parties & online!

Join & support us from wherever you are!

You’re invited to map one of these tasks, although any point added in Tanzania with the tag #TanzaniaDevelopmentTrust or #crowd2map in the 24 hour period from 11am GMT on Saturday 10th August until Sunday 11th August will count.

Volunteers’ contribution in 2019 January – July

The database shows the number of contributions with the #tanzaniadevelopmenttrust and #crowd2map hashtag from January 1 to July 31, 2019. The data is generated with osm-stats from American Red Cross.

Hashtagcrowd2maptanzaniadevelopmenttrust
Roads Added (km)1080.523504.11
Roads Modified (km)377.11281.36
Buildings Added11126657024
Buildings Modified230036827
Waterways Added (km)71.88183.15
POIs Added165574

Training Village Women and Children Protection Committees with #WomenConnect

We are working with Humanitarian OpenStreetMap Team (HOTOSM) who were awarded a grant from the USAID WomenConnect programme to train women to better use digital technology to map and empower their communities which we started implementing this week.

mbalibali village map

This involves visiting each of the 78 villages and holding a meeting with the committee members and showing them the map of their village that we had produced in OpenStreetMap.   This was the first time they had ever seen a map of their village and they found them fascinating.  We then showed them Maps.Me so they could see their location, zoom in and out and compare the digital version with the paper one.

We also trained the committee how to use smartphones as most of them had never used one before. They were very impressed by what they can do and loved the content we had downloaded onto sd cards, including Swahili videos about agriculture, FGM and womens’ rights.  We also showed them how to report incidents of gender based violence, GBV, using a form in OpenDataKit on the phone. As access to smartphones is so low in these communities, especially for women, we are leaving one phone per village to be used in the project.  We were able to do this because of a very generous donation from the FOSS4G conference in Dar es Salaam last year who were so impressed by our work.

Female Genital Mutilation and Gender Based Violence more widely are huge problems in Serengeti District, as in much of Tanzania, and are very under reported, particularly in these remote villages.

The Tanzanian government introduced a policy in 2006 that every village should have a protection committee to address this issue at a local level.  Unfortunately this laudable policy was not followed up by funds for dissemination and implementation.  Serengeti District set up committees in every village in June 2018 but since that time they have had no funding to visit the villages to introduce the programme and train the committee on their responsibilities. So we are delighted to be working with them to ensure the committees in Serengeti are trained in their responsibilities and also have the digital tools for the first time to enable them to carry them out.

16 days of activism against Gender Based Violence in Tanzania

Rhobi and the other FGM activists and community mappers in Mara have been very busy as part of 16 days of activism.  This is the 3rd year they have participated in this global event.

They have been promoting their work protecting girls in many villages around Serengeti, in preparation for the upcoming cutting season which will start next week.  You can follow their progress on their Facebook page here.   Their hard work has meant many cutters have now stopped mutilating girls, and the tide is turning.  However they are currently sheltering 178 girls and the numbers are expected to rise substantially next week when the schools have closed, yesterday alone they received the names of 215 girls at risk who need rescuing, so December will be extremely challenging.  If you would like to help them you can do so here.

They are also getting ready to implement a project called WomenConnect in the new year which will train women leaders in every village of Serengeti district in using mobile phone content to improve livelihoods and access to health and education information.

Mapathon at the United Nations

Last week Rhobi was invited to tell her story as an FGM survivor and activist at a high level panel as part of the United  Nations General Assembly in New York.  She spoke movingly about begging her parents not to cut her, as she feared dying and her body being thrown in the bush to be eaten by wild animals, as had happened to her friend Sabina.  But her pleas were in vain and she was cut and nearly bled to death.  She has since dedicated her life to saving other girls from a similar fate.

You can watch a recording of her testimony here.

The following day Rhobi participated in our mapathon at UNFPA where we explained how better maps can help activists like Rhobi quickly find girls at risk of FGM and showed people how they can help to create them.  There were side events in over 60 countries as part of this global FGM event, including at the Ministry of Women in Somalia, and with FGM activists in Kenya, Guinea, Mali, Niger, Uganda, Djibouti and many more.  Together they mapped over 49,000 buildings and almost 7000 km of roads to better protect girls at risk.

DoI0MZRU8AAfIJg

At UNFPA Tyler and Rebecca from HOT also explained how maps can be used for many humanitarian purposes.  You can see the presentation here. 

And now Rhobi is in London for the UK premiere of the film about her work, In the name of your daughter.  For those of you near London, Nottingham or Yorkshire I hope you may get the chance to watch it and to meet Rhobi.

Join our mapathon at the United Nations!

Its been a very exciting summer for Crowd2Map!

In July we were awarded the best Africa mapping project at the global State of the Map in Milan.

In August we gave a very well received key note at the global FOSS4G in Dar es Salaam, as well as another presentation and 2 workshops.  The conference was so impressed with our work that they decided to give the conference surplus of $15,000 to us to continue promoting mapping groups in rural Tanzania.

And now in September we have been invited to organise a mapathon at the United Nations General Assembly to demonstrate how mapping can help in the fight against FGM.  To coincide with this we are also organising a global online mapathon, details here.  We hope to build a global network to unite people from across the world to help map areas where girls are at risk of FGM so that activists can better protect them.  Please promote in your networks and join us! Together we can #map2endFGM

Success at State of the Map, Milan

We were delighted to be asked to talk at State of the Map in Milan, our presentation is here.   We also were on the panels on Sustainability of mapping projects, the Humanitarian OpenStreetMap microgrants, which we were delighted to receive last year, and the Open Gender Monologues, at which we spoke at some of the additional challenges faced by female mappers in rural Tanzania and what we are doing to address them.  You can see the whole programme for the conference here and watch the presentations online here.

SOTM award

At the end of the conference the OpenStreetMap Foundation presented their annual awards and we were delighted to win in the Africa category!