Mapping health centres in Serengeti

In 2021 we brought you exciting news of a $5,000 Community Impact microgrant awarded to our partner, Hope for Girls and Women by Open Map Development Tanzania (OMDTZ) which was to be used to support with leveraging the use of OSM and mapping to help solve community challenges.

Hope for Girls and Women chose to use the grant to:

  • Expand the existing OSM community in the Serengeti region
  • Add healthcare facilities to maps, helping the local community in the process
  • Collect information about local schools
  • Add other features available in the villages as and when they were encountered during field visits
Image of participants in the health centre mapping training being taught how to map

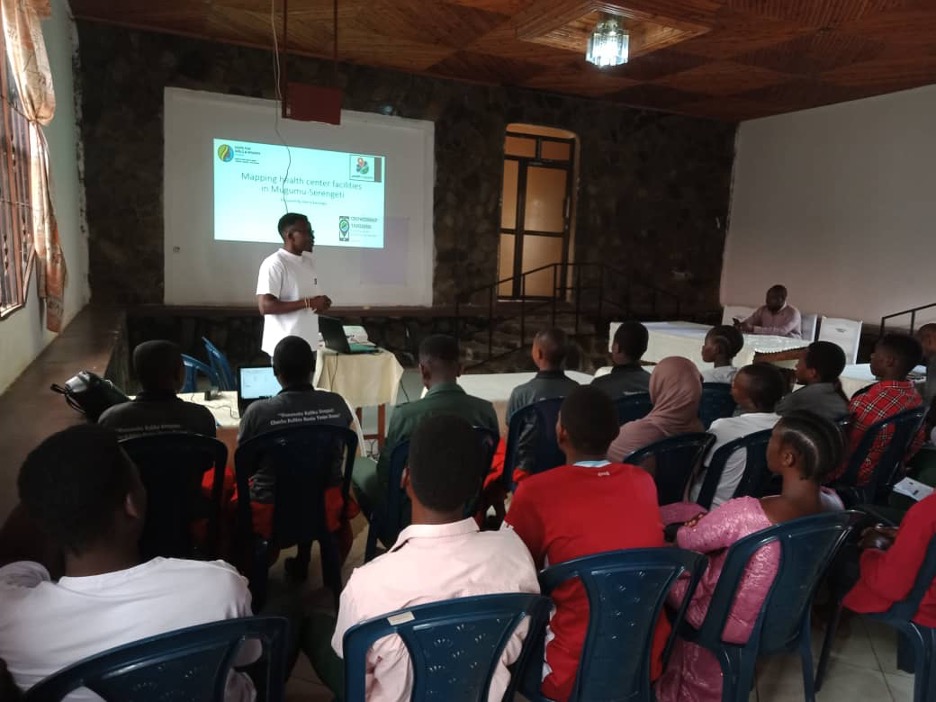
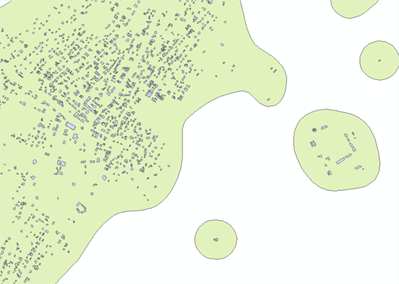
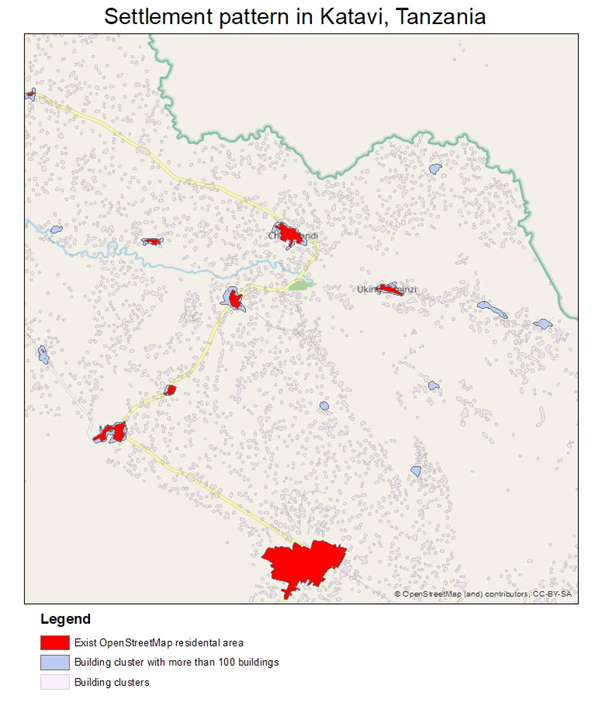
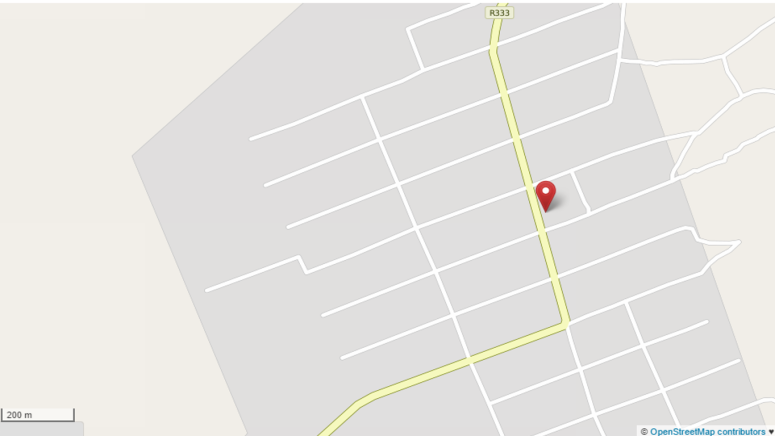
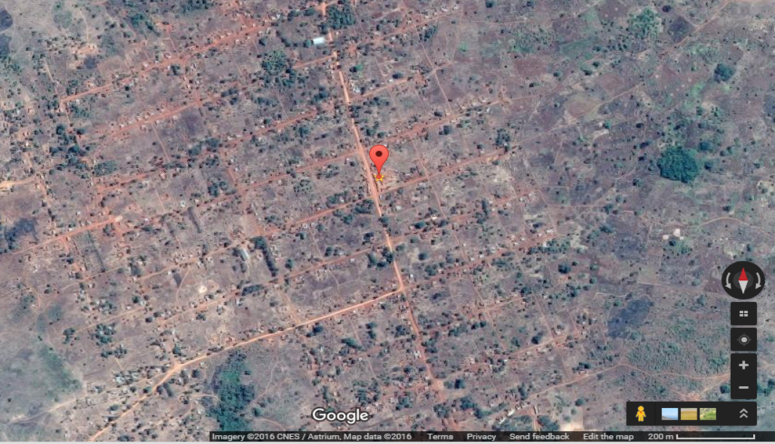
Challenges mapping health centres in Serengeti

The initiative brought with it several challenges and obstacles that needed to be overcome with a strategic approach, taking into consideration the available resources, budget and location of health care facilities. These challenges ranged from:

  • Mapping contributors not having the necessary equipment to submit data. There was a lack of laptops or smartphones at times
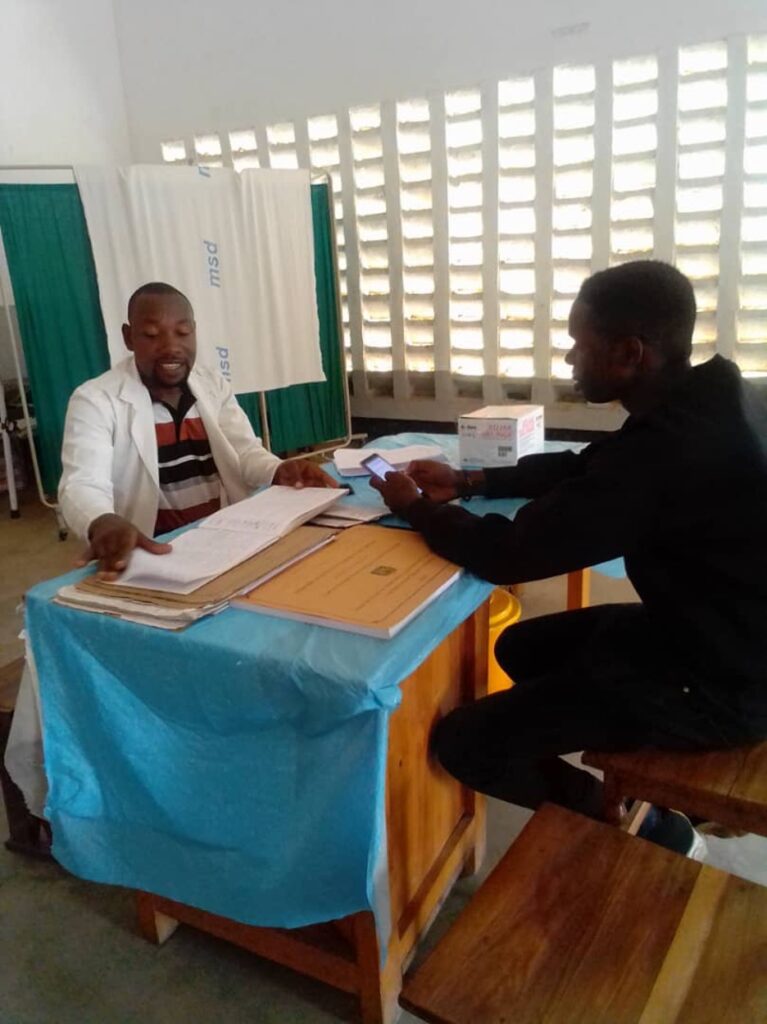
  • Reluctance by private health care centres and laboratory managers and teams to support and collaborate with us by providing information about their sites. At times concerns would take upwards of an hour to resolve with site owners, which added to our timeline
  • We were delayed starting training by two months, this meant we had to spend significant time on refresher sessions for participants
  • Locations of villages in Serengeti can be very remote and with large distances between one another. Couple with very rainy and wet conditions, this added time and difficulty as well as costs to several field visits

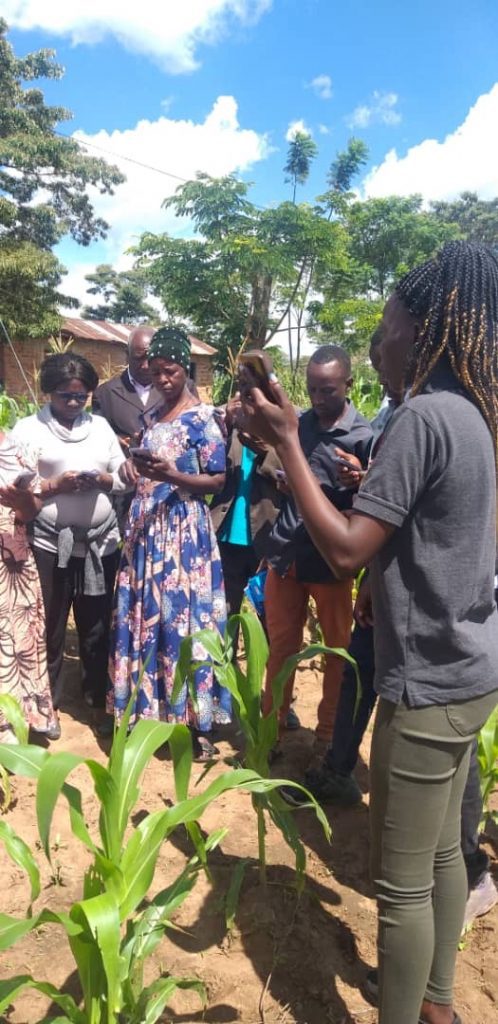
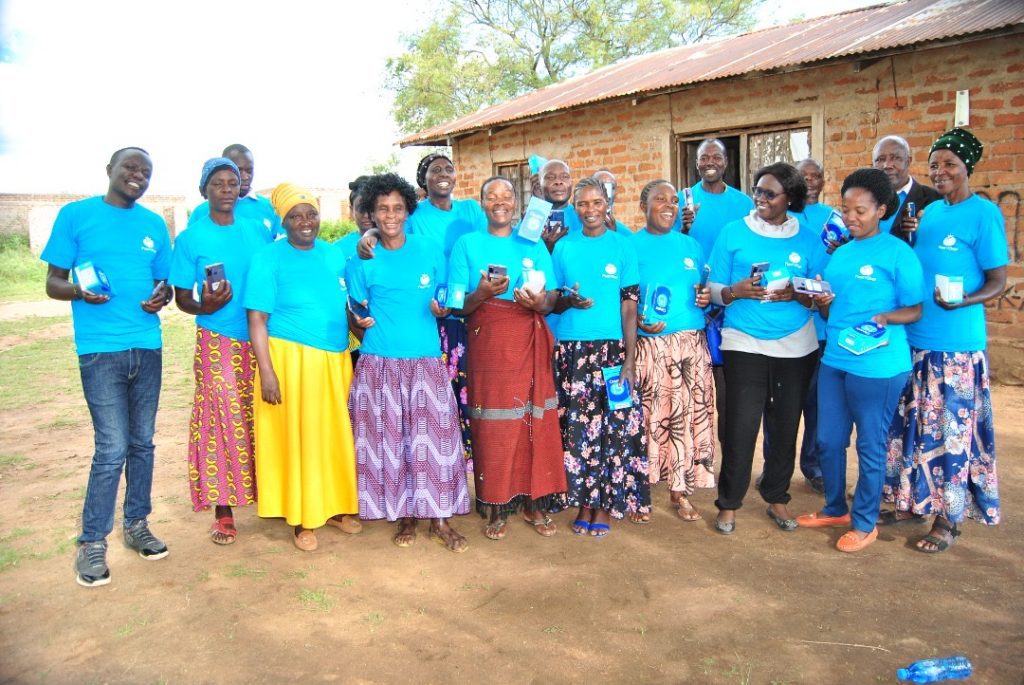
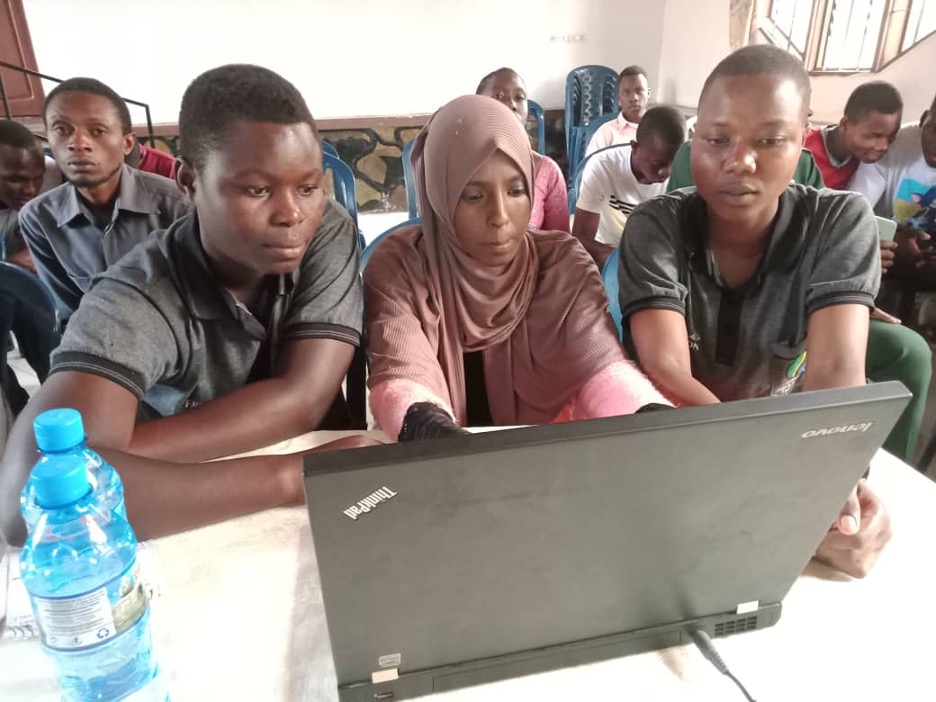
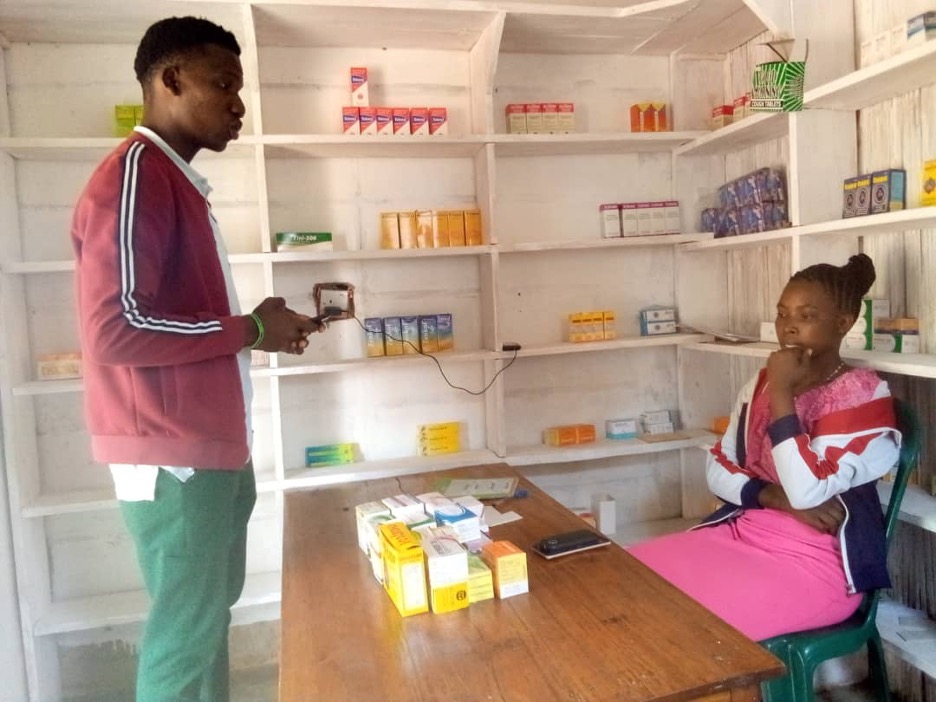
We were successful in involving 35 new local mappers across Mugumu, Serengeti, and trained them on the use of Open Data and how to use it to solve community challenges. This was well received, and we are confident we provided a level of training and expertise, as well as insights and real life working examples to ensure that those involved will continue to not only take an interest in mapping, but also actively participate in mapping moving forward.

Discussions taking place between a mapping contributor and a health care professional

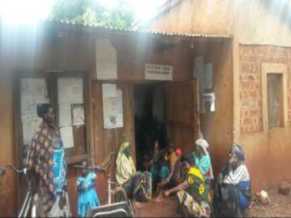
Outcome of the health care mapping initiative

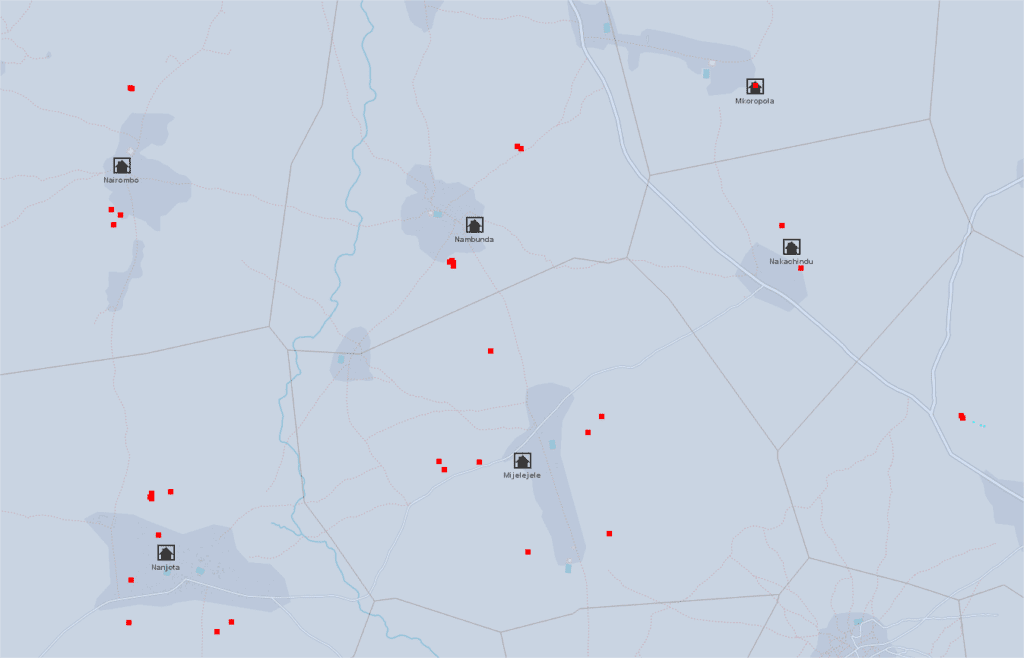
We added the following facilities to maps of Mugumu, Serengeti:

60 Health center facilities where;

  • 2 are Hospitals
  • 15 are clinics
  • 35 are pharmacies
  • 8 laboratories

Collaboration and training across the following partners:

  • MARA RED CROSS: a team of five people participated, building their capacity and understanding on the use of Open Data, we also involved them in the whole process of contributing to mapping activities and improving knowledge on how mapping can help them with solving community challenges. We also agreed to keep sharing our insights on mapping and other related activities that will help the community
  • SETCO Youth Mappers: 10 Youth mappers were involved in this initiative, which opened their eyes to how they can use mapping to solve community challenges.  This will trigger them to be more enthusiastic when identifying ways of using the knowledge acquired.  The easy access to health data is helpful because we need this information to be freely accessible to give the community added support
Girls from Hope for Girls and Women learning to map in Tanzania

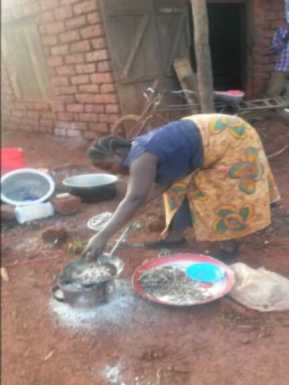
Hope for Girls and Women Tanzania: 5 girls from Hope learned how they can contribute to impacting the community. For some of the girls who are pursuing careers in community development, this was great experience and a dream come true.

Hope for Girls and Women often takes girls to obtain health services, so moving forward it will be possible to participate in updating health facility locations and information and have a better understanding of the procedures of mapping and collecting helpful health information. This also further adds to the positive impact Hope for Girls and Women is having on the local community around Serengeti and Butiama

  • Community Involvement: 5 participants from the Serengeti community were actively involved. It is important to pass on knowledge about mapping and how mapping can help in solving community challenges, especially as these people are often the users of such data.  The ongoing strickle effect of sharing new-found knowledge with other people in the community is an additional benefit of training individuals and small groups.
  • Local Government: We were happy and grateful to have the Deputy District Community Officer and Chairman to participate in the mapping training, helping them to better understand the importance of mapping, how it helps community development and even their own work

What has the impact of the OSM microgrant and associated training been?

The Serengeti community will have an easy way of accessing health center facility data. Hope for Girls and Women Tanzania will also be identifying which health center facilities are available 24 hours a day, and what kind of services are offered at specific health centers

Involving local government officers, village chairmen, and community people, Youth Mappers and other NGOs has helped to raise awareness and interest in using Open Data to solve community challenges. This helps to scale up the knowledge within such groups and also increase contributors and proactivity around mapping.

Having access to health data shows a picture of the local infrastructure, and allows us to better demonstrate  challenges in the community whereby people suffer from a lack of access to health centers. Providing evidence of how far individuals have to travel to find sites, availability of services and staff and opening hours, can be a much needed wakeup call for the Government to finding a solution to reducing the challenges that Serengeti people are facing.

The Villages Chairmen has requested maps showing all features available in their villages in addition to maps which focus on health centers and schools, so we have agreed we will do a participatory mapping in each village, so we people with further training. In return, villages can provide information which we can use to create maps with more details in each village.

We will continue to bring you updates on further mapping projects as they arise. If you have a mapping project that you think could benefit northern Tanzania, and/or if you are aware of grants for such projects, please do reach out to us here.

Using mobile technology to improve the farming of crops in Tanzania

Farmers receive training

On 26th April 2021, Hope for Girls and Women kicked off a programme of agri-technology farmer training in Matare, Serengeti. This exciting collaboration between Hope and PlantNuru, Kenya, provided training that explored the use of digital technology to help farmers protect their crops. Not only does this support the local community with their work, but also provides the opportunity to engage attendees in education and conversation around gender-based violence.

Farmers explore practical training

There were 20 farmers and 7 community leaders involved in the two-day session which was opened by Serengeti’s District Executive Director.  The District Agricultural Officer and District Community Development Officer were also in attendance.

Day one covered the types of disease that can be found in cassava and Maize and how to differentiate between diseases and their impact to crops.

The team then looked at the approaches that can be used to mitigate the infection of these crops, providing a solution on how to plant cassava and maize when you want to increase your production and possible ways of planting cassava for seed.

Day two included a practical session on how to record crop-type data by using PlantVillage app. This included a visit to a maize and cassava farm where disease identification exercises were carried out. Attendees were shown how they can use the  PlantVillage app for the detection of diseases and Pests. Farmers can seek advice from extension officers who are close by as well as from other users, using the app.

This is an innovative new stepping stone for farmers to benefit from agri-technology, which will help the production of their crops.

Twenty farmers were given smart phones at the end of the session.  As well as the PlantVillage app, their phones were installed with maps.me and the ODK form to support the reporting of GBV/FGM cases. All farmers signed the contract upon receiving their phones to commit to use their phones for the targeted work.

20 farmers participate in training

There was very positive feedback from the farmers involved in the session who welcomed this opportunity to enhance their output and support their local community, including vulnerable girls and women.

The PlantVillage app can be downloaded on the GooglePlay and Apple App Store.

MAPPING SMALL SCALE MINING IN KATAVI REGION

Due to its geological framework, Katavi region is endowed with abundant mineral deposits of different kinds including gold, green tourmaline, gemstone, and copper Most of mining activities are conducted by small scale miners. Gold in the Region of Katavi are found in the following areas  Ibindi, Ugalla, Singililwa, Msagiya Kampuni and Mpanda town.

Miners and processors are a highly dynamic group of people. Particularly in gold mining, there are a lot of rushes in the Region of Katavi that may see thousands of workers come and go in a matter  of months. 1 in 3 workers arrived from a different region, and  many others travel within these vast regions in pursuit of employment opportunities. Often, sites have no adequate infrastructure to deal with the influx of workers. Over half of workers operate on a site that has a makeshift camp where workers live and sleep. 

When we visited most of the mining sites in the Region we found that women benefit considerably less from this mineral wealth than men. They remain stuck in lower level positions; they are mainly engaged in processing activities such as crushing and panning. Mining remains a patriarchal sector where men are protective of their positions. As sites are also ill-adapted to women, with, for instance, only few sites having separate sanitary facilities. Paradoxically, most sites cannot function without women, who provide the bulk of support services such as serving food, selling drinks, maintenance and transporting supplies. Another problem prevalent in the mining sites in the Region of Katavi is the problem of child labour. Although illegal, their involvement in mining is widespread. In about half of sites with child labour, children seen working during school hours.

Health and safety are a pressing concern in most mining sites.  There is no access to sanitary facilities in many sites, and where there are available, they are in poor condition or insufficient in number. Combined with the lack of clean drinking water, dust and noise pollution, mines are a breeding ground for numerous infections and disease.

Mining activities also severely impact the environment in Katavi through water pollution, deforestation and land degradation.

Considering these challenges, it is clear that considerable work remains to be done in enforcing the law on these sites. 

Good Harvest Organisation, in conjunction with the local Red Cross, are mapping the mining the mining sites by training its members and equipping them with mobile phones and open-source mobile data collection applications to capture coordinates, take  pictures and complete dedicated questionnaires, to bridge information gaps around mining in the region of Katavi. This will be done in two main phases.

The first phase will consist of a broad mobile survey on the socio-economic and human rights impact of mining in the region. we will survey all communities around mines on their perceptions regarding the impact of these operations. The findings of this data collection will be published and given to the key stakeholders.  This data will enable hands-on follow-up by the Government of Tanzania and local NGOs.  

Detecting pests in Maize and Cassava with the PlantNuru app

Agriculture is the backbone of the rural economy in Tanzania and the families of girls at risk of FGM and GBV are farmers.

Although in theory there are networks of agriculture extension officers to help them, often in practice they are too far away to be of any use. Therefore, we were very pleased to learn of the PlantVillage Nuru app which seeks to help farmers improve their practice.  In February 2021 TDT  had an online training session for people interested in how to use this free app to detect Fall Army Worm (a pest for maize) and Cassava diseases which was attended by our volunteer and GIS specialist Herry Kasunga. 

Since then he has been out training our Digital Champions to use the app. As maize and cassava are the main staple crops grown in their areas this is particularly important.

Here you can see the Digital Champion for Burunga village, Agness Marinya checking her crops with the app.  She says, “It is an easy way to monitor crops and give you feedbacks on how crops grow, and I will provide training to other farmers in my village.

“With better agriculture people are less likely to need to cut their daughters and sell them for cows.  I have 3 children all girls. I am so proud of my work as a Digital Champion in Burunga, because there have been so much changes in my village.

“Now the number of girls who are cut is reduced. We all need to raise our voices to say no so our children can live free from FGM.”

The slides from our training session are here, and the recording here.  You can also view and download the slides Herry used for training the digital champions below.

Please watch this space for further updates on how this helpful app is being used in Tanzania. 

How mapping is helping Tanzanian villages source water


At the Humanitarian OpenStreetMap Team global conference on Friday December 4 2020, Herry Kasunga talked about the Water Source mapping project that he has been coordinating with the Hope for Girls and Women digital champions.

Herry Kasunga

This is an extremely important project as the majority of people in Mara, as in the rest of Tanzania, are dependent on rainwater for household water, sanitation and to grow their food. It is also estimated that 40% of village water sources are degraded or non-functional. The shots below show some of the water points used by the digital champions:

In addition, climate change further threatens water access and means droughts and average temperature rises are likely, coupled with intense flooding events with significant damage to infrastructure and livelihoods, meaning mapping will become even more important.

Herry’s presentation slides are available here.


Missing villages In Tanzania II

Scene 2 – Find the village

Since the first part of our “Missing villages” project is already in the finish line, we have to explain the second part, which called “Find the village”.

In the first phase, we tried to name the village, now we have to create the village boundaries, if possible. As we said in the previous article, the delimitation of human habitats is not easy, the structure of the settlement is often region dependent. In the Ruvuma region (southern Tanzania) the settlements are well separated on the map. In contrast, in agricultural areas of the Shinyanga region, delimitation sometimes seems an impossible task.

Sources

According to the data created by Digital Globe and funded by the Gates Foundation, approximately 17 million buildings are in Tanzania. By the time that this study was made, the OSM community has mapped circa 11 million building so far, so using buildings data from OpenStreetMap is not enough, we had to use a different source to identify the settlement pattern. To map populations, we used the previously mentioned data from the Gates Foundation and Facebook’s High-Resolution Population Density data for validation.

Workflow

A building aggregation tool was prepared in ArcGIS to aggregate the building footprints (Polygon layer) to produce settlement layers.

  1. At first, buffer building footprints by 50m was created then merged
  2. Secondly, the merged multipolygons were divided into single polygons.
  3. Each settlement patterns area was measured, also the covered buildings were counted for each “building cluster”. These two data can help us to calculate:
    1. Building density (number of buildings / total area)
    1. Number of buildings, which data can help to predict the number of the population
    1. The building density and building number can help in the classification of settlements
      1. Urban or rural area
      1. Settlement type: hamlet, village, or town
  4. During the post-process, sharp angles in polygon were outlined and made smoother to improve aesthetic or cartographic quality. Finally, the unwanted “holes” from polygons were eliminated.

Using this data, we can identify the settlement pattern which can help us creating settlement boundaries for bigger villages, – especially with high building density – and adding to OSM.

In the final steps, first we have to remove those from the resulting settlement boundaries that are already in the OSM database. Secondly – using the validated settlement POIs, we select those settlement boundaries features that contain the village’s point features.

In the end, the selected village boundaries will be uploaded to OSM and will be waiting for phase 3.

Missing villages In Tanzania

Knowing the vast, rural area of Tanzania is crucial to provide timely and effective help for girls during Female Genital Mutilation (FGM) ‘cutting seasons’. In recent years, we have managed to map millions of buildings which can help us determine the distribution of the population. Although low population density areas in Tanzania are not sufficiently mapped yet, the initial steps have already been taken.

Goals of mapping

Crowd2Map Tanzania is a “crowdsourced mapping project aiming to put rural Tanzania on the map”. A primary goal is to help fight against FGM. Girls are rescued and taken to safe houses by local volunteers and police. However, for this they need maps. But maps can do more than just show these rescue teams the way to remote villages. The existence of spatial information can help with development and to increase commercial efficiency and economic growth opportunities for businesses and entrepreneurs, giving them the opportunity to make better-informed decisions. Growing wealth improves the quality of life, gives a chance for more opportunities and a better quality of education.

Find the village

So, we now know where to find traces of human settlements, but how do we delineate each settlement and, more importantly, how do we know what the name of the settlement is?

The delimitation of human habitats is not easy, the structure of the settlement is often region dependent. What does it mean? In the Ruvuma region (southern Tanzania) the settlements are well separated on the map. In contrast, in agricultural areas of the Shinyanga region, delimitation sometimes seems an impossible task.

And what about the names of the settlements? Local volunteers can help us identify all the names of circa 10,000 – 12,000 settlements in Tanzania, OR we can try to find some open source data which contains this information. Recruiting hundreds of volunteers from all over the country is beyond our power, so we need to focus on the second SOLUTION in most places. Fortunately, we have some open source data from The United Republic of Tanzania – Government Basic Statistics Portal, like health facilities or schools, or waterpoints located all over Tanzania.  

Our project objective is to add the missing village names in Tanzania, using open source government data about water sources in Tanzania. 

Water Points Location in Rural Water Supply – 2015-2016

Method for the estimation of village position

The shared database contains about 87,000 water sources, which can be lakes, rivers, machine drilled boreholes or springs. The database also contains the physical condition (quality, quantity) of the water sources as well as their spatial location, indicating, for example, the village name where the water source is, or the nearest village to it. This data helps us determine the name of the village in OSM.

Workflow

For data validation the best possible application is JOSM, which can prepare our data to upload to OSM after data validation. During validation, the next datasets and imagery were used: 

  1. Thyessen polygons were calculated from the water points layer, to get the influence zone of each water point. Then, the polygons were merged by attribute, where the village name is the same. The resulting polygons can help to determine the area where the village has to be.
  2. In the same time, Mean center was calculated for the points inside a polygon → potential position of the village. (Since in a few cases the name of a village occurs more than once in the country, a “village+district” combined data was used to help us to find the real mean center.) This is our village data POI which need to be implemented to OSM.
  3. OpenStreetMap imagery was used to identify the trace of human activity if the area was well mapped. We were also able to get an answer as to whether the name of the settlement has already been given to OSM. 
  4. Maxar satellite imagery was used for those areas that weren’t mapped yet. 
  5. Other useful datasets for validation
    • Waterpoints: can be really useful, if the position of the village’s POI is unusually far from any populated area. In this case, it is worth looking at how each water point is located in the area. Another example, when the village consists of two sub-villages, then the “SUBVILLAGE” attribute of the water database can help determine where the center of the village can be.
    • Health facilities data: The government data contains more than 7,000 health facilities like hospitals or clinics. The names of these facilities are usually, but not exclusively, the same as the name of the municipality where it is located. 
    • Education data: The government data contains almost 7,000 schools. The village names are available in this data. 

In summary

The Voronoi polygon assigns the area where the village is located (or has to be). The village POI assigns the potential location of the settlement, BUT its accuracy depends on the number of water abstraction points and their location in/around the given settlement.

In a well-mapped area - where, moreover, the settlements can be easily separated from each other - we did not have a difficult time with validation (mean centers before validation).
In a well-mapped area – where, moreover, the settlements can be easily separated from each other – we did not have a difficult time with validation (mean centers before validation).
The mean center of the Waterpoints sometimes clearly shows the center of the settlement if these water points are evenly distributed within and around the settlement.

Provisional results

By the end of September, more than 143 districts were validated (88% of all districts), and 5505 villages POIs were added which is 52% of the total village POIs in Tanzania.

User nameTotal edits
Bgabor1802
SHABANI MAGAWILA2255
Kasunga884
Stuart Ward49
Number of edits by users – which was added with “TNZ_missing_villages” hashtag

Crowd2map volunteers in the lead

The OSM database currently contains 10483 Tanzanian village points, a significant part was added by the volunteers of the Crowd2map team. The following pie chat shows how this 10483 POIs is divided between the TOP5 volunteers and the rest of mapper community:

Updated results – 31/10/2020

By the end of October, more than 157 districts were validated (97% of all districts), and 6759 villages POIs were added.

Zeze Village

Putting Zeze on the map – a post by our friends MBONI YA VIJANA youth community in Zeze – paints a picture of the Zeze village, as well as documents the very beginnings of the Crowd2Map Tanzania, and how we hope to literally put it on the map. Why is that so important? Well, see for yourself:

This is how Zeze Village looks on Google Map at the moment: (marked point is the village market, -4.89913606, 30.0578204)

Zeze Google Map

This is how it looked liked 6 months ago on Open Street Map:

Map of Zeze

Sad, isn’t it.

Thank’s to a fantastic Missing Maps initiative in the Kigoma region in Tanzania, Zeze on Open Street Map now looks like this: (A little better? But still…)

Zeze OSM

(Note, that neither find “Zeze” if you search for it by name.)

This is how it actually looks via satellite:

Zeze Google Satellite

A little more than a blank space, eh..?

And we have nearly 20 points so far, marking its schools, shops and offices, to name a few:

Village Office in Zeze
Zeze Village Office
Zeze School Library
Zeze School Library (-4.91136445, 30.0474693)
Mtus Restaurant
Mtus Restaurant (-4.89908231, 30.05751572)
Kulu's Bicycle Shop (-4.89918704, 30.05762403)
Kulu’s Bicycle Shop (-4.89918704, 30.05762403)

… and there are many more.


Zeze is not as blank as the map might suggest, after all..?

Will you help us put Zeze on the map? Drop us a line below or reach out via email!